Note
Go to the end to download the full example code.
Operations on Vectors#
This example shows how to perform some basic operations slicing and selecting vectors. This is designed to be very flexible and powerful. Many operations such as slicing with a boolean array are supported.
Additionally, lazy operations are supported and can be chained together. These are often faster
than their non-lazy counterparts as dask very effectively prunes the computation graph.
import pyxem as pxm
import hyperspy.api as hs

hs.set_log_level("ERROR")

s = pxm.data.tilt_boundary_data()
temp = s.template_match_disk(disk_r=5, subtract_min=False)

vectors = s.get_diffraction_vectors(threshold_abs=0.4, min_distance=5)
  0%|          | 0/51 [00:00<?, ?it/s]
 29%|██▉       | 15/51 [00:00<00:00, 147.16it/s]
 65%|██████▍   | 33/51 [00:00<00:00, 147.26it/s]
100%|██████████| 51/51 [00:00<00:00, 173.10it/s]

  0%|          | 0/51 [00:00<?, ?it/s]
  2%|▏         | 1/51 [00:00<00:06,  8.23it/s]
 18%|█▊        | 9/51 [00:00<00:01, 38.96it/s]
 33%|███▎      | 17/51 [00:00<00:00, 47.30it/s]
 49%|████▉     | 25/51 [00:00<00:00, 52.03it/s]
 65%|██████▍   | 33/51 [00:00<00:00, 55.32it/s]
 80%|████████  | 41/51 [00:00<00:00, 55.64it/s]
100%|██████████| 51/51 [00:00<00:00, 56.31it/s]

  0%|          | 0/51 [00:00<?, ?it/s]
100%|██████████| 51/51 [00:00<00:00, 4116.97it/s]
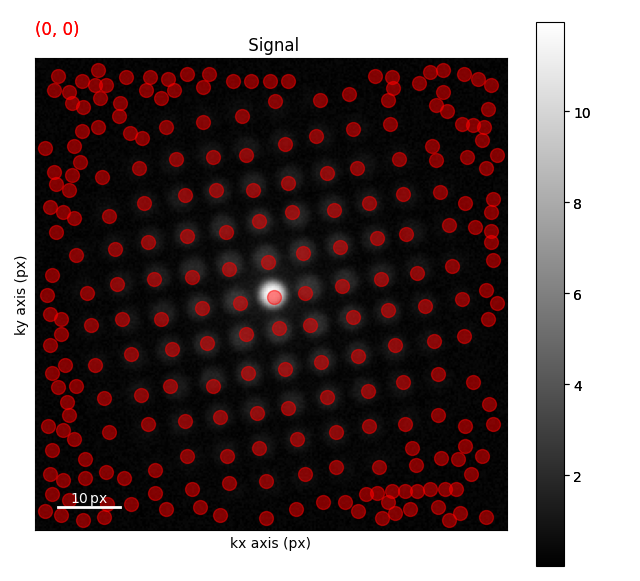
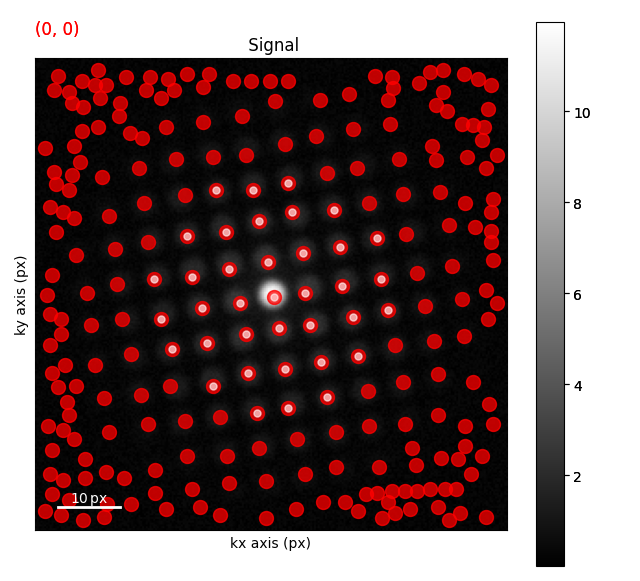
Plotting all the vectors
s.plot()
all_vectors = vectors.to_markers(color="red", sizes=10, alpha=0.5)
s.add_marker(all_vectors)
  0%|          | 0/51 [00:00<?, ?it/s]
100%|██████████| 51/51 [00:00<00:00, 5519.53it/s]
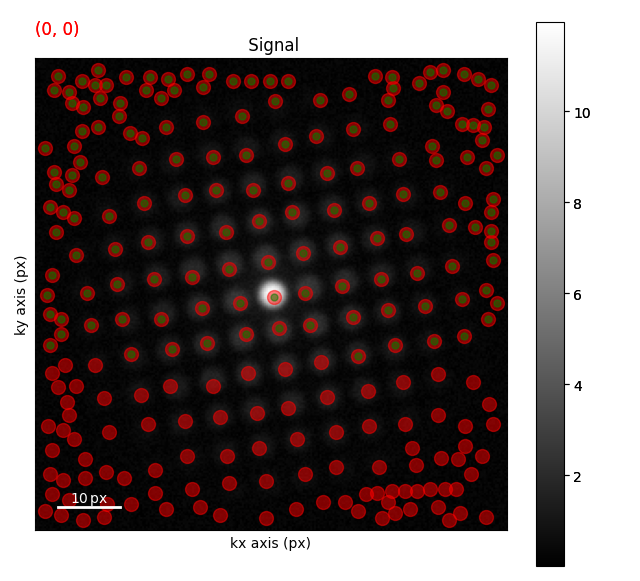
slic_vectors = (vectors.ivec[:, vectors.ivec[0] < 10]).to_markers(
    color="green", sizes=5, alpha=0.5
)

s.plot()
s.add_marker([all_vectors, slic_vectors])

  0%|          | 0/51 [00:00<?, ?it/s]
100%|██████████| 51/51 [00:00<00:00, 5765.75it/s]

  0%|          | 0/51 [00:00<?, ?it/s]
100%|██████████| 51/51 [00:00<00:00, 6185.57it/s]

  0%|          | 0/76 [00:00<?, ?it/s]
100%|██████████| 76/76 [00:00<00:00, 5903.53it/s]

  0%|          | 0/51 [00:00<?, ?it/s]
100%|██████████| 51/51 [00:00<00:00, 5058.64it/s]
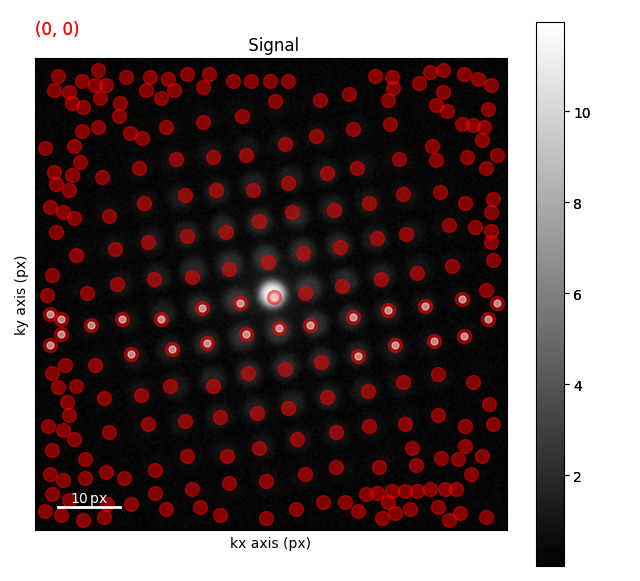
slic_vectors = (
    vectors.ivec[:, (vectors.ivec[0] > 0) * (vectors.ivec[0] < 10)]
).to_markers(color="w", sizes=5, alpha=0.5)
s.plot()
s.add_marker([all_vectors, slic_vectors])

  0%|          | 0/51 [00:00<?, ?it/s]
100%|██████████| 51/51 [00:00<00:00, 6132.73it/s]

  0%|          | 0/51 [00:00<?, ?it/s]
100%|██████████| 51/51 [00:00<00:00, 6732.01it/s]

  0%|          | 0/51 [00:00<?, ?it/s]
100%|██████████| 51/51 [00:00<00:00, 6106.99it/s]

  0%|          | 0/51 [00:00<?, ?it/s]
100%|██████████| 51/51 [00:00<00:00, 5982.65it/s]

  0%|          | 0/76 [00:00<?, ?it/s]
100%|██████████| 76/76 [00:00<00:00, 6806.17it/s]

  0%|          | 0/51 [00:00<?, ?it/s]
100%|██████████| 51/51 [00:00<00:00, 7857.68it/s]
vect_magnitudes = (vectors.ivec[0] ** 2 + vectors.ivec[1] ** 2) ** 0.5
slic_vectors = vectors.ivec[:, vect_magnitudes < 20].to_markers(
    color="w", sizes=5, alpha=0.5
)
s.plot()
s.add_marker([all_vectors, slic_vectors])
s.add_marker([all_vectors, slic_vectors])

  0%|          | 0/51 [00:00<?, ?it/s]
100%|██████████| 51/51 [00:00<00:00, 7598.38it/s]

  0%|          | 0/51 [00:00<?, ?it/s]
100%|██████████| 51/51 [00:00<00:00, 5253.95it/s]

  0%|          | 0/51 [00:00<?, ?it/s]
100%|██████████| 51/51 [00:00<00:00, 5608.09it/s]

  0%|          | 0/76 [00:00<?, ?it/s]
100%|██████████| 76/76 [00:00<00:00, 5813.31it/s]

  0%|          | 0/51 [00:00<?, ?it/s]
100%|██████████| 51/51 [00:00<00:00, 6388.98it/s]
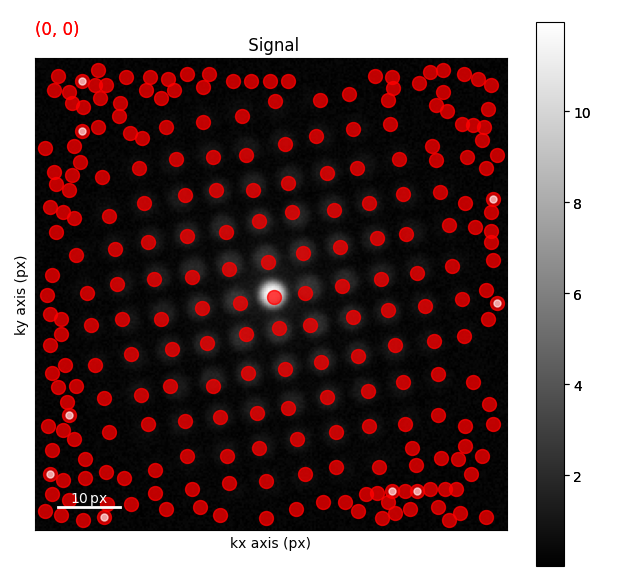
slic_vectors = (vectors.ivec[:, vectors.ivec["intensity"] < 0.5]).to_markers(
    color="w", sizes=5, alpha=0.5
)
s.plot()
s.add_marker([all_vectors, slic_vectors])
s.add_marker([all_vectors, slic_vectors])

  0%|          | 0/51 [00:00<?, ?it/s]
100%|██████████| 51/51 [00:00<00:00, 7607.84it/s]

  0%|          | 0/51 [00:00<?, ?it/s]
100%|██████████| 51/51 [00:00<00:00, 7374.66it/s]

  0%|          | 0/76 [00:00<?, ?it/s]
100%|██████████| 76/76 [00:00<00:00, 7160.25it/s]

  0%|          | 0/51 [00:00<?, ?it/s]
100%|██████████| 51/51 [00:00<00:00, 7310.40it/s]
sphinx_gallery_thumbnail_number = 8
Total running time of the script: (0 minutes 4.850 seconds)