Note
Go to the end to download the full example code.
Glass Symmetry from Vectors#
This example shows how to identify symmetry (in a glassy system but this could be useful other places) by looking at the angles between 3 vectors in the diffraction pattern at some radial ring in k to identify groups of 3 vectors that are subtended by the same angle.
This is a very simple example with more detailed examples to come.
import pyxem as pxm
from scipy.ndimage import gaussian_filter
import matplotlib.pyplot as plt
import numpy as np
First we load the data and do some basic processing
s = pxm.data.pdnip_glass(allow_download=True)
s.axes_manager.signal_axes[0].offset = -23.7
s.axes_manager.signal_axes[1].offset = -19.3

s.filter(gaussian_filter, sigma=(1, 1, 0, 0), inplace=True)  # only in real space
s.template_match_disk(disk_r=5, subtract_min=False, inplace=True)

vectors = s.get_diffraction_vectors(threshold_abs=0.5, min_distance=3)
  0%|          | 0/17 [00:00<?, ?it/s]
  6%|▌         | 1/17 [00:05<01:30,  5.63s/it]
 29%|██▉       | 5/17 [00:11<00:24,  2.02s/it]
 47%|████▋     | 8/17 [00:11<00:09,  1.08s/it]
 59%|█████▉    | 10/17 [00:16<00:11,  1.60s/it]
 76%|███████▋  | 13/17 [00:22<00:06,  1.68s/it]
100%|██████████| 17/17 [00:22<00:00,  1.31s/it]

  0%|          | 0/33 [00:00<?, ?it/s]
  3%|▎         | 1/33 [00:04<02:09,  4.03s/it]
 21%|██        | 7/33 [00:04<00:11,  2.27it/s]
 30%|███       | 10/33 [00:07<00:17,  1.34it/s]
 39%|███▉      | 13/33 [00:07<00:09,  2.03it/s]
 48%|████▊     | 16/33 [00:08<00:05,  2.94it/s]
 58%|█████▊    | 19/33 [00:11<00:08,  1.59it/s]
 70%|██████▉   | 23/33 [00:11<00:04,  2.46it/s]
 76%|███████▌  | 25/33 [00:15<00:05,  1.40it/s]
 94%|█████████▍| 31/33 [00:15<00:00,  2.62it/s]
100%|██████████| 33/33 [00:15<00:00,  2.09it/s]

  0%|          | 0/51 [00:00<?, ?it/s]
100%|██████████| 51/51 [00:00<00:00, 619.55it/s]
Now we can convert to polar vectors
pol = vectors.to_polar()
  0%|          | 0/51 [00:00<?, ?it/s]
 24%|██▎       | 12/51 [00:00<00:00, 118.24it/s]
 47%|████▋     | 24/51 [00:00<00:00, 108.24it/s]
 80%|████████  | 41/51 [00:00<00:00, 129.63it/s]
100%|██████████| 51/51 [00:00<00:00, 135.52it/s]
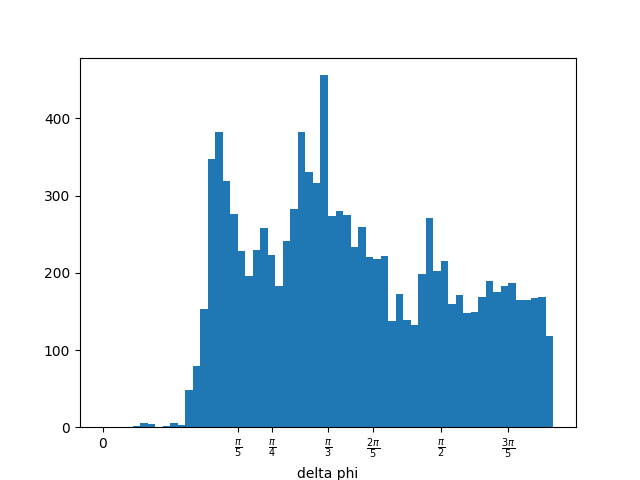
This function gets the inscribed angle accept_threshold is the maximum difference between the two angles subtended by the 3 vectors
ins = pol.get_angles(min_angle=0.05, min_k=0.3, accept_threshold=0.1)

flat_vect = ins.flatten_diffraction_vectors()

fig, axs = plt.subplots()
axs.hist(flat_vect.ivec["delta phi"].data, bins=60, range=(0, 2 * np.pi / 3))
axs.set_xlabel("delta phi")
axs.set_xticks(
    [0, np.pi / 5, np.pi / 4, 2 * np.pi / 5, np.pi / 2, np.pi / 3, 3 * np.pi / 5]
)
axs.set_xticklabels(
    [
        0,
        r"$\frac{\pi}{5}$",
        r"$\frac{\pi}{4}$",
        r"$\frac{2\pi}{5}$",
        r"$\frac{\pi}{2}$",
        r"$\frac{\pi}{3}$",
        r"$\frac{3\pi}{5}$",
    ]
)
  0%|          | 0/51 [00:00<?, ?it/s]
  2%|▏         | 1/51 [00:00<00:38,  1.30it/s]
  6%|▌         | 3/51 [00:01<00:14,  3.29it/s]
 10%|▉         | 5/51 [00:01<00:10,  4.27it/s]
 14%|█▎        | 7/51 [00:01<00:07,  5.90it/s]
 18%|█▊        | 9/51 [00:02<00:10,  4.10it/s]
 22%|██▏       | 11/51 [00:02<00:08,  4.50it/s]
 25%|██▌       | 13/51 [00:04<00:15,  2.41it/s]
 29%|██▉       | 15/51 [00:04<00:14,  2.49it/s]
 33%|███▎      | 17/51 [00:05<00:10,  3.34it/s]
 41%|████      | 21/51 [00:05<00:05,  5.26it/s]
 45%|████▌     | 23/51 [00:07<00:10,  2.70it/s]
 49%|████▉     | 25/51 [00:07<00:08,  3.12it/s]
 53%|█████▎    | 27/51 [00:07<00:06,  3.65it/s]
 57%|█████▋    | 29/51 [00:08<00:05,  4.39it/s]
 61%|██████    | 31/51 [00:08<00:05,  3.71it/s]
 65%|██████▍   | 33/51 [00:09<00:05,  3.33it/s]
 69%|██████▊   | 35/51 [00:09<00:04,  3.99it/s]
 73%|███████▎  | 37/51 [00:10<00:04,  3.47it/s]
 76%|███████▋  | 39/51 [00:11<00:03,  3.19it/s]
 84%|████████▍ | 43/51 [00:12<00:02,  2.83it/s]
 88%|████████▊ | 45/51 [00:13<00:02,  2.83it/s]
 96%|█████████▌| 49/51 [00:13<00:00,  4.60it/s]
100%|██████████| 51/51 [00:13<00:00,  3.70it/s]

  0%|          | 0/2 [00:00<?, ?it/s]
100%|██████████| 2/2 [00:00<00:00, 3311.73it/s]

[Text(0.0, 0, '0'), Text(0.6283185307179586, 0, '$\\frac{\\pi}{5}$'), Text(0.7853981633974483, 0, '$\\frac{\\pi}{4}$'), Text(1.2566370614359172, 0, '$\\frac{2\\pi}{5}$'), Text(1.5707963267948966, 0, '$\\frac{\\pi}{2}$'), Text(1.0471975511965976, 0, '$\\frac{\\pi}{3}$'), Text(1.8849555921538759, 0, '$\\frac{3\\pi}{5}$')]
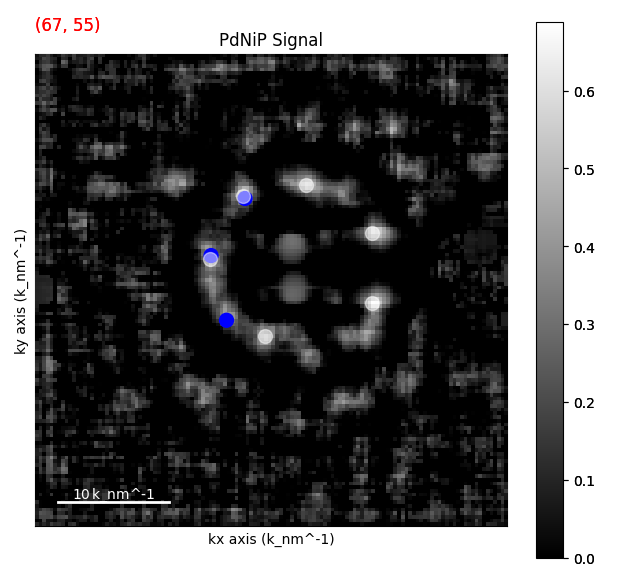
cycle through colors in groups of 3 for each symmetry cluster
points = ins.to_markers(
color=["b", "b", "b", "g", "g", "g", "y", "y", "y", "r", "r", "r"]
)
original_points = vectors.to_markers(color="w", alpha=0.5)
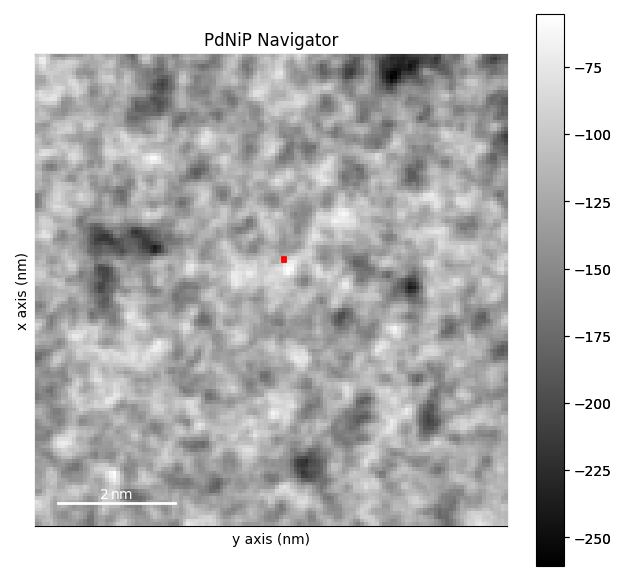
s.axes_manager.indices = (67, 55) # jumping to a part with some symmetric structure
s.plot(vmin=0.0)
s.add_marker(points)
s.add_marker(original_points)
  0%|          | 0/51 [00:00<?, ?it/s]
 45%|████▌     | 23/51 [00:00<00:00, 189.81it/s]
 84%|████████▍ | 43/51 [00:00<00:00, 193.37it/s]
100%|██████████| 51/51 [00:00<00:00, 217.08it/s]

  0%|          | 0/51 [00:00<?, ?it/s]
100%|██████████| 51/51 [00:00<00:00, 1106.83it/s]

  0%|          | 0/51 [00:00<?, ?it/s]
100%|██████████| 51/51 [00:00<00:00, 1064.07it/s]
Total running time of the script: (1 minutes 27.050 seconds)